Avaliação do possível papel do acaso em testes imparciais

papel do acaso pode levar-nos a cometer dois tipos de erros quando interpretamos os resultados de comparações imparciais de tratamentos: podemos concluir erradamente que existem diferenças reais nos resultados quando elas realmente não existem, ou que não existem diferenças quando, na verdade, elas existem. Quanto maior o número de resultados de interesse dos tratamentos observados, menor será a probabilidade de nos enganarmos dessas maneiras.

Como as comparações dos tratamentos não podem incluir todas as pessoas com a condição que foram ou serão tratadas, jamais será possível descobrir definitivamente “as diferenças reais” entre tratamentos. No entanto, os estudos têm de produzir as melhores hipóteses do que as diferenças reais provavelmente são. A confiabilidade das diferenças estimadas é muitas vezes indicada por intervalos de confiança (IC), que fornecem uma variação na qual as diferenças reais podem estar. A maioria das pessoas já conhece o conceito dos IC, mesmo que não seja por esse nome. Por exemplo, na corrida eleitoral, uma pesquisa de opinião pode relatar que o Partido A tem uma vantagem de 10% de pontos sobre o Partido B. No entanto, depois o relatório apontará que muitas vezes a diferença entre os partidos poderia ser tão pequena quanto 5 pontos ou tão grande quanto 15 pontos. Esse IC indica que a diferença real entre os partidos pode estar entre 5 e 15% dos pontos. Quanto maior
o número de pessoas entrevistadas, menor será a incerteza sobre os resultados, e, por isso, o IC associado à estimativa da diferença será menor.
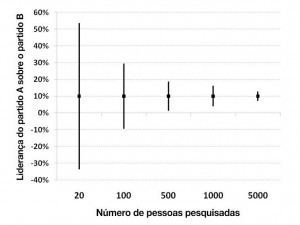
Diagram of confidence intervals

O Intervalo de confiança (IC) de 95% da diferença entre o Partido A e o Partido B encurta conforme aumenta o número de pessoas sondadas 

Assim como é possível avaliar o grau de incerteza ao redor de uma diferença estimada nas proporções dos eleitores que apoiam dois partidos políticos, também é possível avaliar o grau de incerteza ao redor de uma diferença estimada nas proporções de pacientes que melhoram ou pioram após dois tratamentos. E aqui, mais uma vez, quanto maior o número dos resultados do tratamento observado – p.ex., recuperação após um ataque cardíaco – em uma comparação de dois tratamentos, menores serão os IC que circundam as estimativas das diferenças do tratamento. Com relação aos IC, “quanto menor,
melhor”.

Um IC é normalmente acompanhado por uma indicação do nível de confiança que podemos ter de que o valor real reside dentro da gama das estimativas apresentadas. IC de 95%, por exemplo, indica que podemos confiar 95% no valor real de qualquer coisa estimada dentro da gama do IC. Isso significa que existe uma chance de 5 em 100 (5%) de que, efetivamente, o valor “real” esteja fora do intervalo.


  • Steve George

    Overall this is a superb book and website. However, the stated meaning of ‘confidence interval’ is not correct. Maybe this is an intentional simplification because the book and website are intended for a broad audience. However, it makes one suspicious about other claims made by the authors if one of the important aspects is wrong. The correct meaning of a 95% confidence interval is that 95 out of 100 confidence intervals obtained in the same way (same population and same sample size) will include the true mean. To say that there’s a 95% chance that the true mean lies within the confidence interval would mean that there many different true means, and 95 out of 100 of them fall within this particular confidence interval. Of course there is only one true mean, and it will lie within 95 out of 100 similarly-obtained confidence intervals.

  • Anonymous

    Many thanks for your kind words Steve, and I am sure that the team will want to make sure that everything is as accurate as it can be.

    You are right, in that the intention is to explain confidence intervals for an informed lay reader. I know from experience that this is not easy, and that sometimes an approximation is easier to understand.

    Stay tuned and I will see what they say.

  • Paul Glasziou

    Thanks for your complimentary remarks about the book. We might have used a different approach in our effort to explain confidence intervals, and we discussed this when writing the section. The deliberate simplification we used reflected our experience of trying to explain the precise frequentist interpretation of confidence intervals to lay audiences: this approach either seems to confuse them or goes over their heads. We could also have used Credible Interval and a uniform prior to match our more Bayesian explanation (http://en.wikipedia.org/wiki/Credible_interval), but that is not the term people are likely to come across.
    We are currently searching systematically for formal comparisons of the extent to which among alternative wording to explain research methods most helps lay people to get the right end of the stick. This is one of several issues that we would like to see addressed empirically to improve the evidence base needed to support better understanding of health research. Please let us know if you would like to be involved, and we would also encourage you and readers to become involved in http://www.nsuhr.net – An international Network to Support Understanding of Health Research.

  • Robert42

    Confidence intervals represent the uncertainty of an estimate attributable to sampling error. Small sample, bigger error, broader confidence interval. Big sample, smaller error, narrower confidence interval. If the sample encompasses all of the sample frame the uncertainty falls to zero and the confidence intervals disappear.

    A 95% confidence interval means that if we were to repeat our test 100 times, the calculated confidence intervals would encompass the mean arrived at through full and complete coverage of the sample frame roughly 95 times. This mean is not a ‘true’ value. Confidence intervals only represent the uncertainty from sampling. There will be other errors in the measurement system that will forever keep us from knowing the ‘truth’. This is why Deming insists that there is no truth in measurement and the idea there is, is so destructive to understanding statistical analysis.

    To conclude say, a difference between a treatment and control group is statistically significant at the 95% level, only means our experiment would come to similar estimates 95% of the time. It doesn’t mean the difference is real or true. (After all, we already knew the two groups were different.) All manners of statistical significance are comments on the measurement system used, not the reality being measured.